
The Bitcoin market is experiencing heightened volatility as September traditionally brings seasonal headwinds to cryptocurrency prices. Current BTC price predictions from leading analysts suggest a potential correction that could push Bitcoin below $90,000 in the coming week, marking a significant shift from recent bullish momentum. Breaking below $105K support could accelerate selling toward $95K-$99K levels, while policy disappointments could target $78K-$80K, according to recent technical analysis. This cryptocurrency market analysis reveals several converging factors that could trigger substantial price movements. September can be a weaker month for Bitcoin, but “this year feels a little different”, as institutional adoption continues to evolve alongside regulatory developments.
These market dynamics becomes crucial for both retail and institutional investors navigating the current Bitcoin trading landscape. The current BTC market sentiment reflects uncertainty amid global macroeconomic pressures, Federal Reserve policy expectations and technical resistance levels. The current BTC price is $112,225.11 as of 09.09.2025. The BTC price reached its all-time high of $124,349.51 on 14.08.2025, highlighting the recent volatility range that traders are closely monitoring. This comprehensive analysis will explore the five most critical factors influencing Bitcoin’s price trajectory in the immediate term. bitcoin trading signals
Technical Analysis Critical Support Levels Under Pressure
Key Resistance and Support Zones
The Bitcoin technical analysis reveals several critical price levels that could determine the cryptocurrency’s short-term direction. Bitcoin price prediction for September 2025 remains bullish as BTC trades above $111k and could rally toward $120K if the $112K–$115K resistance is cleared, suggesting that current price action remains at a pivotal juncture.
However, cryptocurrency analysts are closely watching the $105,000 support level, as a break below this threshold could accelerate selling pressure. The BTC price chart shows convergence at multiple technical indicators, including the 200-day exponential moving average and key Fibonacci retracement levels that historically have provided strong support.
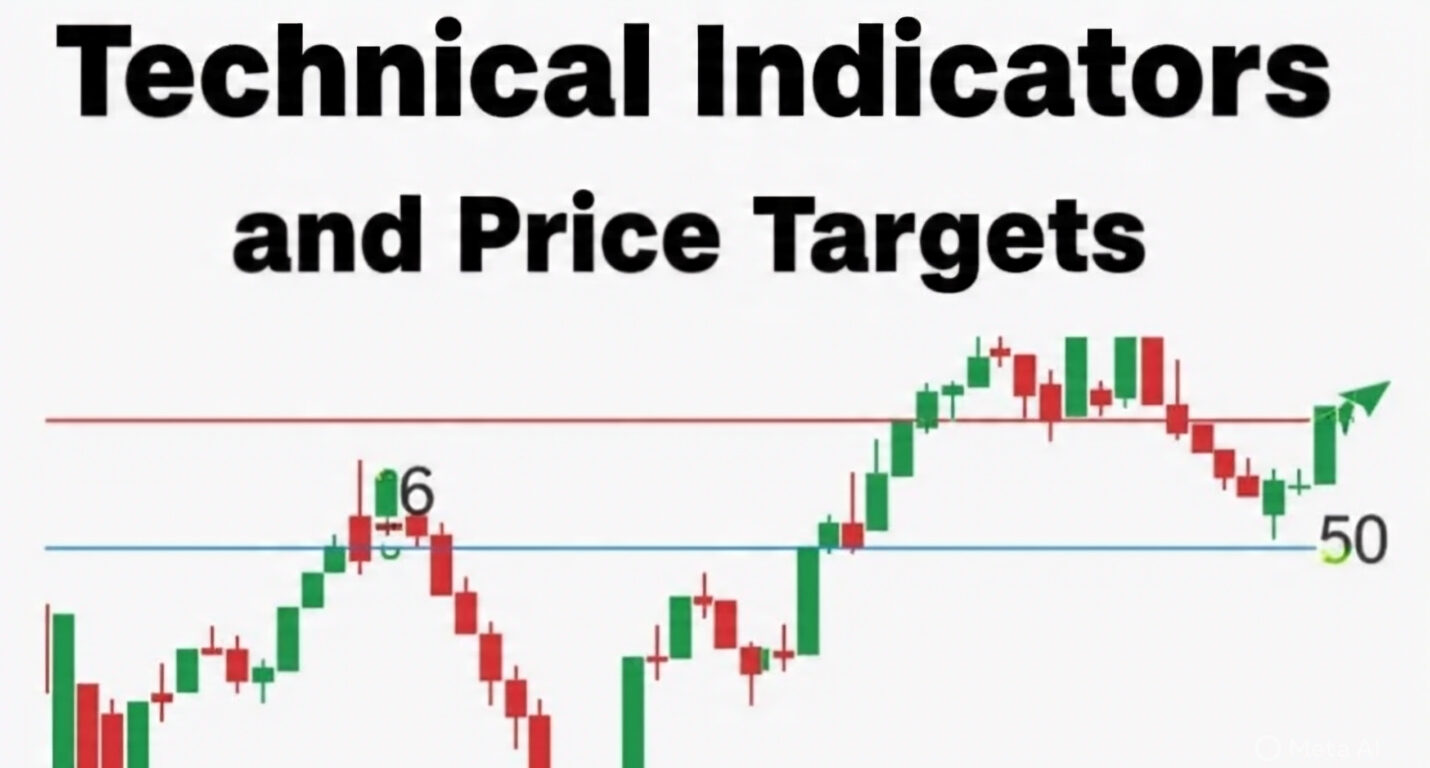
Moving Average Convergence and Divergence
The BTC/USD forecast shows failure at the 50-day EMA, indicating potential weakness in the near-term trend structure. This technical development suggests that Bitcoin market trends may be shifting from the previous bullish momentum established earlier in 2025. bitcoin trading signals
The digital currency market is experiencing increased volatility as various technical indicators provide conflicting signals. While some metrics suggest oversold conditions that could trigger a relief rally, others indicate potential for further downside if key support levels fail to hold.
Seasonal Patterns September’s Historical Impact on Bitcoin
Historical September Performance
Bitcoin price faces seasonal September weakness as it drops below $110,000, but historical trends and potential Fed rate cuts point to a possible “Uptober” rally ahead. This seasonal pattern has been observed consistently across multiple market cycles, with September typically showing weaker performance compared to other months.
The Bitcoin market history demonstrates that seasonal factors often influence cryptocurrency price movements, particularly during September when trading volumes may decrease due to vacation periods and institutional rebalancing. However, crypto market experts note that this year’s unique macroeconomic environment could potentially alter traditional seasonal patterns.
Q4 Rally Expectations
Despite September’s typical weakness, many Bitcoin investment professionals remain optimistic about the fourth quarter outlook. Historical data suggests that October often marks the beginning of stronger performance periods, potentially setting the stage for significant price appreciation as the year concludes.
The concept of “Uptober” has gained traction among cryptocurrency traders, referring to Bitcoin’s tendency to perform well during October. This seasonal expectation, combined with potential Federal Reserve policy changes, could create favorable conditions for BTC price recovery following any September weakness.
Federal Reserve Policy Impact and Interest Rate Dynamics
Monetary Policy Expectations
Most traders were looking for interest rate cuts in the September meeting from the Federal Reserve, the question now is going to be “How many rate cuts between now and the end of the year?” This uncertainty surrounding Federal Reserve policy continues to influence Bitcoin market dynamics significantly. bitcoin trading signals
The relationship between traditional monetary policy and cryptocurrency markets has become increasingly correlated, with Bitcoin often moving in response to Federal Reserve announcements and interest rate expectations. Lower interest rates generally benefit risk assets like Bitcoin by reducing the opportunity cost of holding non-yielding investments.
Market Liquidity Considerations
Federal Reserve policy decisions directly impact global liquidity conditions, which in turn affect crypto market cap and trading volumes. As institutional investors increasingly treat Bitcoin as a legitimate asset class, monetary policy changes can trigger significant capital flows in and out of cryptocurrency markets. The current Bitcoin market analysis suggests that any dovish signals from the Federal Reserve could provide support for cryptocurrency prices, while hawkish policy stances might contribute to further selling pressure and potential moves below $90,000.
Institutional Investment Flows and Market Structure Changes

Corporate and Institutional Adoption
Positive regulatory expectations and increased institutional adoption spurred Bitcoin to break the $100,000 barrier for the first time on December 5, 2025, demonstrating the significant impact of institutional participation on Bitcoin’s price trajectory.Bitcoin trading signals Current Bitcoin investment trends show continued interest from institutional investors despite short-term price volatility. However, profit-taking and shifts in monetary policy have contributed to recent price weakness, suggesting that institutional flows can work in both directions.
Exchange-Traded Fund (ETF) Impact
The Bitcoin ETF market continues to mature, providing new avenues for institutional and retail investment. These investment vehicles have contributed to increased trading volumes and price discovery mechanisms, while also potentially increasing volatility during periods of significant inflows or outflows.
Cryptocurrency market structure evolution includes the growing influence of traditional financial institutions, which brings both opportunities and challenges. While institutional participation provides legitimacy and capital, it also introduces new sources of volatility based on traditional market factors.
Global Economic Factors and Geopolitical Influences
International Market Pressures
The ongoing Israel-Iran conflict has prompted U.S. intervention, resulting in another surge in social volume. Bitcoin’s price dipped to $98,000, but analysts expect a strong rally in H2 2025. Geopolitical events continue to influence Bitcoin market sentiment and price movements. Global economic uncertainty often drives investors toward alternative assets, including Bitcoin, as a hedge against traditional market volatility. However, severe market stress can also trigger widespread selling across all risk assets, including cryptocurrencies.
Currency Devaluation and Inflation Hedging
The digital asset market continues to benefit from concerns about fiat currency devaluation and long-term inflation expectations. Bitcoin’s role as a potential store of value becomes more prominent during periods of monetary uncertainty and fiscal expansion by global governments. Cryptocurrency adoption in regions experiencing currency instability further supports the fundamental thesis for Bitcoin ownership, even as short-term technical factors suggest potential price weakness below $90,000.
Market Outlook and Trading Considerations
Risk Management Strategies
Current Bitcoin trading strategies should emphasize risk management given the potential for increased volatility. Changelly’s Bitcoin price predictions September 2025 show potential volatility with a minimum target of $108,802 and maximum of $124,283, highlighting the wide range of possible outcomes. bitcoin trading signals
Professional traders are implementing various hedging strategies to protect against downside risk while maintaining exposure to potential upside moves. These approaches include using options, futures and other derivative instruments to manage portfolio risk during uncertain market conditions.
Long-term Investment Perspective
Despite short-term volatility concerns, many Bitcoin investors maintain a long-term positive outlook based on fundamental adoption trends, technological developments and macroeconomic factors. In 2025, the BTC price is projected to trade between $108,982 and $127,486, with a possible increase to $132,000, suggesting significant upside potential beyond current volatility.
The cryptocurrency market forecast for the remainder of 2025 remains generally optimistic, with many analysts viewing potential September weakness as a buying opportunity for long-term investors. This perspective emphasizes the importance of maintaining a balanced approach between short-term trading considerations and long-term investment goals.
Technical Indicators and Price Targets
Support and Resistance Analysis
Key Bitcoin price levels to monitor include the $105,000 support zone, which has provided significant buying interest in recent weeks. A break below this level could trigger additional selling toward the $95,000-$99,000 range, where stronger support may emerge. On the upside, BTC resistance levels at $115,000 and $120,000 remain important targets for any recovery rally. Successfully clearing these levels would suggest that the current correction may be complete and that Bitcoin could resume its longer-term upward trajectory.
Volume and Momentum Indicators
Bitcoin trading volume patterns continue to provide important insights into market sentiment and potential price direction. Current volume levels suggest increased institutional activity, which could contribute to both upside and downside volatility depending on the direction of major investor flows. Momentum indicators present a mixed picture, with some suggesting oversold conditions that could support a near-term bounce, while others indicate potential for continued weakness if key support levels fail to hold.
Conclusion
The Bitcoin market stands at a critical juncture as multiple factors converge to create potential downside pressure toward the $90,000 level. While seasonal patterns, technical analysis and Federal Reserve policy uncertainty suggest possible near-term weakness, the longer-term outlook remains supported by continued institutional adoption and fundamental cryptocurrency market developments.
Bitcoin price predictions for the remainder of September indicate increased volatility, with the potential for significant moves in either direction based on how key support and resistance levels are tested. Investors should prepare for potentially challenging market conditions while maintaining focus on longer-term investment objectives and appropriate risk management strategies.
Read More: Bitcoin Price Analysis for Day Trading Complete Guide 2025