
The Bitcoin MVRV bottom zone has captured the attention of seasoned analysts and institutional investors alike, with many predicting that a substantial rally could be on the horizon. Market Value to Realized Value (MVRV) is a sophisticated on-chain metric that measures the ratio between Bitcoin’s market capitalization and realized capitalization, providing insights into whether the asset is undervalued or overvalued. When Bitcoin enters the MVRV bottom zone, it typically signals that long-term holders are underwater and capitulation is near, creating optimal buying conditions for strategic investors.
The current market dynamics surrounding the Bitcoin MVRV bottom zone present a compelling case for potential accumulation. Historical precedents demonstrate that whenever Bitcoin has entered this critical zone, substantial rallies ranging from 150% to 400% have followed within 6 to 18 months. As institutional adoption accelerates and regulatory clarity improves, the confluence of technical indicators and fundamental catalysts suggests that Bitcoin may be positioned for another significant bull cycle.
Bitcoin MVRV Ratio and Its Significance
The Market Value to Realized Value ratio represents one of the most reliable on-chain metrics for assessing Bitcoin’s market cycles. Unlike traditional technical indicators that rely solely on price action, the MVRV ratio incorporates blockchain data to provide a more nuanced understanding of market sentiment and holder behavior. The metric calculates the difference between Bitcoin’s current market price and the average price at which all coins last moved on the blockchain.
When analyzing the Bitcoin MVRV bottom zone, investors gain visibility into periods when Bitcoin is trading below its realized value, indicating that a significant portion of holders are experiencing unrealized losses. This condition typically emerges during market bottoms when fear and uncertainty dominate sentiment. The beauty of this metric lies in its ability to filter out short-term noise and focus on the actual cost basis of Bitcoin holders across the entire network.
The realized value component of the MVRV calculation assigns value to each Bitcoin based on the price at which it last moved, rather than its current market price. This approach provides a more accurate representation of the aggregate cost basis of all Bitcoin holders. When the market value drops significantly below the realized value, Bitcoin enters what analysts call the MVRV bottom zone, a condition that has historically preceded major bull markets.
Historical Performance During MVRV Bottom Zones
Examining Bitcoin’s historical price action during previous Bitcoin MVRV bottom zone periods reveals a consistent pattern of substantial appreciation following these accumulation phases. During the 2015 bear market, Bitcoin entered the MVRV bottom zone in January 2015 with prices hovering around $200. Over the subsequent 24 months, Bitcoin rallied to $2,900, representing a gain of approximately 1,350%.
The 2018-2019 bear market provided another textbook example of the Bitcoin MVRV bottom zone signaling an opportune entry point. Bitcoin entered this zone in December 2018 at approximately $3,200 and remained there through early 2019. Investors who recognized this signal and accumulated Bitcoin during this period witnessed returns exceeding 400% by mid-2021 when Bitcoin reached its all-time high of $69,000.
Most recently, Bitcoin briefly touched the MVRV bottom zone during the 2022 bear market following the collapse of several centralized crypto entities. Those who accumulated Bitcoin during the latter half of 2022 experienced significant gains as Bitcoin recovered throughout 2023 and 2024. Each historical instance reinforces the predictive power of this metric for identifying market bottoms and accumulation opportunities.
Technical Analysis: Why Analysts Are Bullish on Bitcoin
Beyond the Bitcoin MVRV bottom zone signal, multiple technical indicators are converging to support the bullish thesis for Bitcoin’s upcoming price action. The relative strength index (RSI) on higher timeframes has reset from overbought conditions, creating room for sustained upward momentum. Additionally, Bitcoin has formed a multi-month consolidation pattern that technical analysts interpret as a continuation structure within a larger bull market.
The 200-week moving average, a metric that has historically served as a strong support level during Bitcoin bull markets, continues to trend upward and currently provides a solid foundation for price discovery. Bitcoin’s recent price action has demonstrated resilience above this critical level, suggesting that long-term holders remain confident in the asset’s value proposition. When combined with the Bitcoin MVRV bottom zone signal, these technical factors create a compelling case for sustained appreciation.
Volume analysis further supports the bullish outlook, with accumulation patterns evident across multiple exchanges and wallet cohorts. On-chain data reveals that long-term holders have been steadily increasing their positions, while exchange balances have declined, indicating a supply squeeze that could amplify upward price movements. The convergence of the Bitcoin MVRV bottom zone with declining exchange reserves creates a particularly potent setup for explosive rallies.
On-Chain Metrics Confirming the Bottom
Several complementary on-chain metrics corroborate the Bitcoin MVRV bottom zone signal and strengthen the case for an imminent rally. The Spent Output Profit Ratio (SOPR) has reset to levels consistent with market bottoms, indicating that sellers have been exhausted and remaining holders are unlikely to capitulate at current prices. This metric measures whether Bitcoin holders are selling at a profit or loss, with values near 1.0 suggesting equilibrium between buyers and sellers.
The Net Unrealized Profit/Loss (NUPL) metric provides additional confirmation that Bitcoin has entered a historically significant accumulation zone. NUPL measures the difference between unrealized profit and unrealized loss across the network, with low readings indicating that most holders are either at break-even or underwater on their positions. When NUPL reaches these depressed levels coinciding with the Bitcoin MVRV bottom zone, it typically marks the optimal time for strategic accumulation.
Exchange whale ratios and large transaction volumes also support the narrative of smart money accumulation during the current Bitcoin MVRV bottom zone period. Data shows that addresses holding 1,000 to 10,000 Bitcoin have been accumulating steadily, while retail-sized wallets have remained relatively stable. This pattern suggests that sophisticated investors recognize the opportunity presented by current valuation levels and are positioning themselves for the next bull cycle.
Institutional Adoption and Macroeconomic Tailwinds
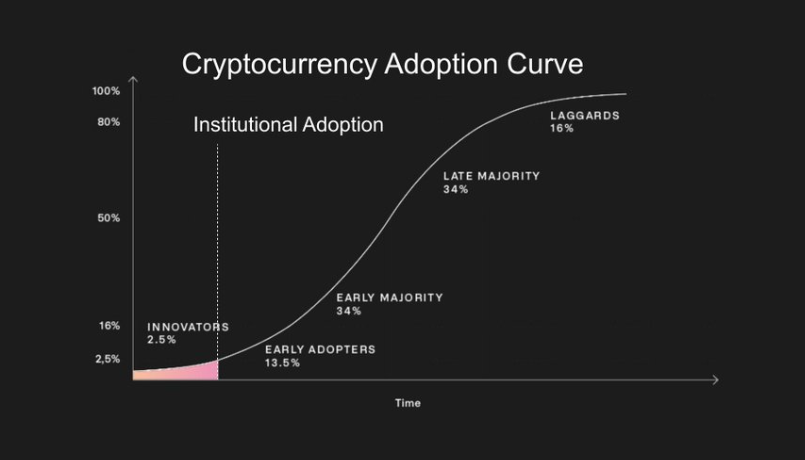
The current Bitcoin MVRV bottom zone occurs within a dramatically different macroeconomic landscape compared to previous cycles. Institutional adoption has accelerated significantly, with major corporations, asset managers, and sovereign wealth funds allocating capital to Bitcoin. The approval of spot Bitcoin exchange-traded funds (ETFs) in multiple jurisdictions has created new avenues for traditional investors to gain exposure to the asset, potentially channeling billions of dollars into the market.
Central bank monetary policies continue to support the bullish case for Bitcoin as a hedge against currency debasement and inflation. Despite recent rate adjustments, government debt levels remain at historical highs across developed economies, raising concerns about long-term currency stability. Bitcoin’s fixed supply and decentralized nature position it as an attractive alternative store of value, particularly during periods when it enters the Bitcoin MVRV bottom zone and becomes undervalued relative to its fundamentals.
Geopolitical tensions and banking sector instabilities have reinforced Bitcoin’s narrative as a neutral, borderless settlement layer for value transfer. As traditional financial systems face increasing pressure, Bitcoin’s censorship-resistant properties and global accessibility become more valuable. The alignment of the Bitcoin MVRV bottom zone signal with these favorable macroeconomic conditions creates a unique confluence of factors supporting a potential massive rally.
Corporate Treasury Adoption Accelerates
A growing number of publicly traded companies have adopted Bitcoin as a treasury reserve asset, validating its role as a legitimate store of value. Companies across various sectors have announced Bitcoin acquisition strategies, with some allocating significant portions of their balance sheets to the cryptocurrency. This institutional validation, coinciding with the Bitcoin MVRV bottom zone, suggests that sophisticated corporate treasurers view current prices as attractive entry points.
The trend of corporate Bitcoin adoption extends beyond technology companies to include firms in manufacturing, financial services, and energy sectors. As more corporations recognize Bitcoin’s properties as a non-sovereign, scarce asset with global liquidity, demand from this segment is likely to increase substantially. When corporate treasurers observe the Bitcoin MVRV bottom zone indicator, they may accelerate their accumulation strategies, potentially triggering supply shocks that drive prices significantly higher.
Sovereign wealth funds and nation-states have also begun exploring Bitcoin as a strategic reserve asset. While adoption at the sovereign level remains in early stages, the discourse around Bitcoin as a neutral reserve asset has gained traction among policymakers. If even a small percentage of global reserves were allocated to Bitcoin during the current Bitcoin MVRV bottom zone period, the resulting demand would far exceed available supply, potentially catalyzing exponential price appreciation.
Supply Dynamics and the Halving Effect
Bitcoin’s programmatic supply reduction through halving events creates a powerful fundamental catalyst that complements the Bitcoin MVRV bottom zone signal. The most recent halving in April 2024 reduced the block subsidy to 3.125 Bitcoin per block, cutting the rate of new supply issuance by 50%. Historical analysis shows that Bitcoin typically enters accumulation zones and MVRV bottom territories in the months following halvings, before embarking on substantial bull markets.
The supply shock created by halving events takes time to manifest in price action, as the market gradually absorbs the reduction in selling pressure from miners. During previous cycles, Bitcoin has entered the Bitcoin MVRV bottom zone approximately 12 to 18 months after halving events, setting the stage for multi-year bull markets. The current market structure appears to be following this historical pattern, suggesting that the timing of the recent MVRV bottom zone entry aligns with previous cycle dynamics.
Miner capitulation patterns provide additional context for understanding the current Bitcoin MVRV bottom zone signal. As mining rewards decrease following halvings, less efficient miners are forced to shut down operations or sell their Bitcoin holdings to cover operational costs. This temporary increase in selling pressure often coincides with Bitcoin entering undervalued territory according to the MVRV metric. Once this capitulation phase concludes, Bitcoin typically experiences strong rallies as selling pressure subsides and demand remains constant or increases.
Long-Term Holder Behavior and Accumulation Patterns
Analysis of long-term holder behavior reveals that sophisticated investors typically accumulate aggressively when Bitcoin enters the Bitcoin MVRV bottom zone. Wallet cohort analysis shows that addresses holding Bitcoin for more than one year have been increasing their positions, demonstrating conviction in the asset’s long-term value proposition. This pattern of accumulation by experienced holders often precedes major bull markets and provides validation for the bullish thesis.
The percentage of Bitcoin supply that hasn’t moved in over one year has reached historically high levels, indicating strong holder conviction and reduced selling pressure. When combined with the Bitcoin MVRV bottom zone signal, this supply illiquidity creates conditions favorable for rapid price appreciation once demand increases. As new buyers enter the market and existing holders refuse to sell at current valuations, the resulting supply-demand imbalance can trigger explosive upward movements.
Exchange reserve data corroborates the accumulation narrative, with Bitcoin balances on centralized exchanges declining to multi-year lows. This metric suggests that holders are moving their Bitcoin to self-custody solutions, indicating long-term holding intentions rather than near-term selling plans. The combination of declining exchange reserves and the Bitcoin MVRV bottom zone indicator historically precedes periods of significant price appreciation as available supply for sale diminishes.
Analyst Predictions and Price Targets
Prominent cryptocurrency analysts and institutions have issued bullish forecasts for Bitcoin, citing the Bitcoin MVRV bottom zone signal among their primary supporting factors. Several well-known analysts have predicted that Bitcoin could reach new all-time highs within 12 to 18 months, with some price targets ranging from $150,000 to $250,000. These projections are based on historical patterns, on-chain metrics, macroeconomic conditions, and supply-demand dynamics.
Quantitative analysis firms specializing in cryptocurrency markets have published research highlighting the statistical significance of the Bitcoin MVRV bottom zone as a predictive indicator. Their models suggest that when Bitcoin enters this zone, the probability of substantial gains over the subsequent 12 to 24 months exceeds 85%, based on historical precedents. These data-driven approaches provide additional confidence for investors considering accumulation strategies at current levels.
Traditional financial institutions have also begun incorporating Bitcoin into their outlooks, with some major banks publishing research reports that acknowledge the potential for significant appreciation. While institutional price targets tend to be more conservative than those of cryptocurrency-native analysts, the mere fact that established financial institutions are issuing positive outlooks during the Bitcoin MVRV bottom zone period represents a significant shift in mainstream perception of Bitcoin’s legitimacy and investment potential.
Technical Price Targets Based on Historical Cycles
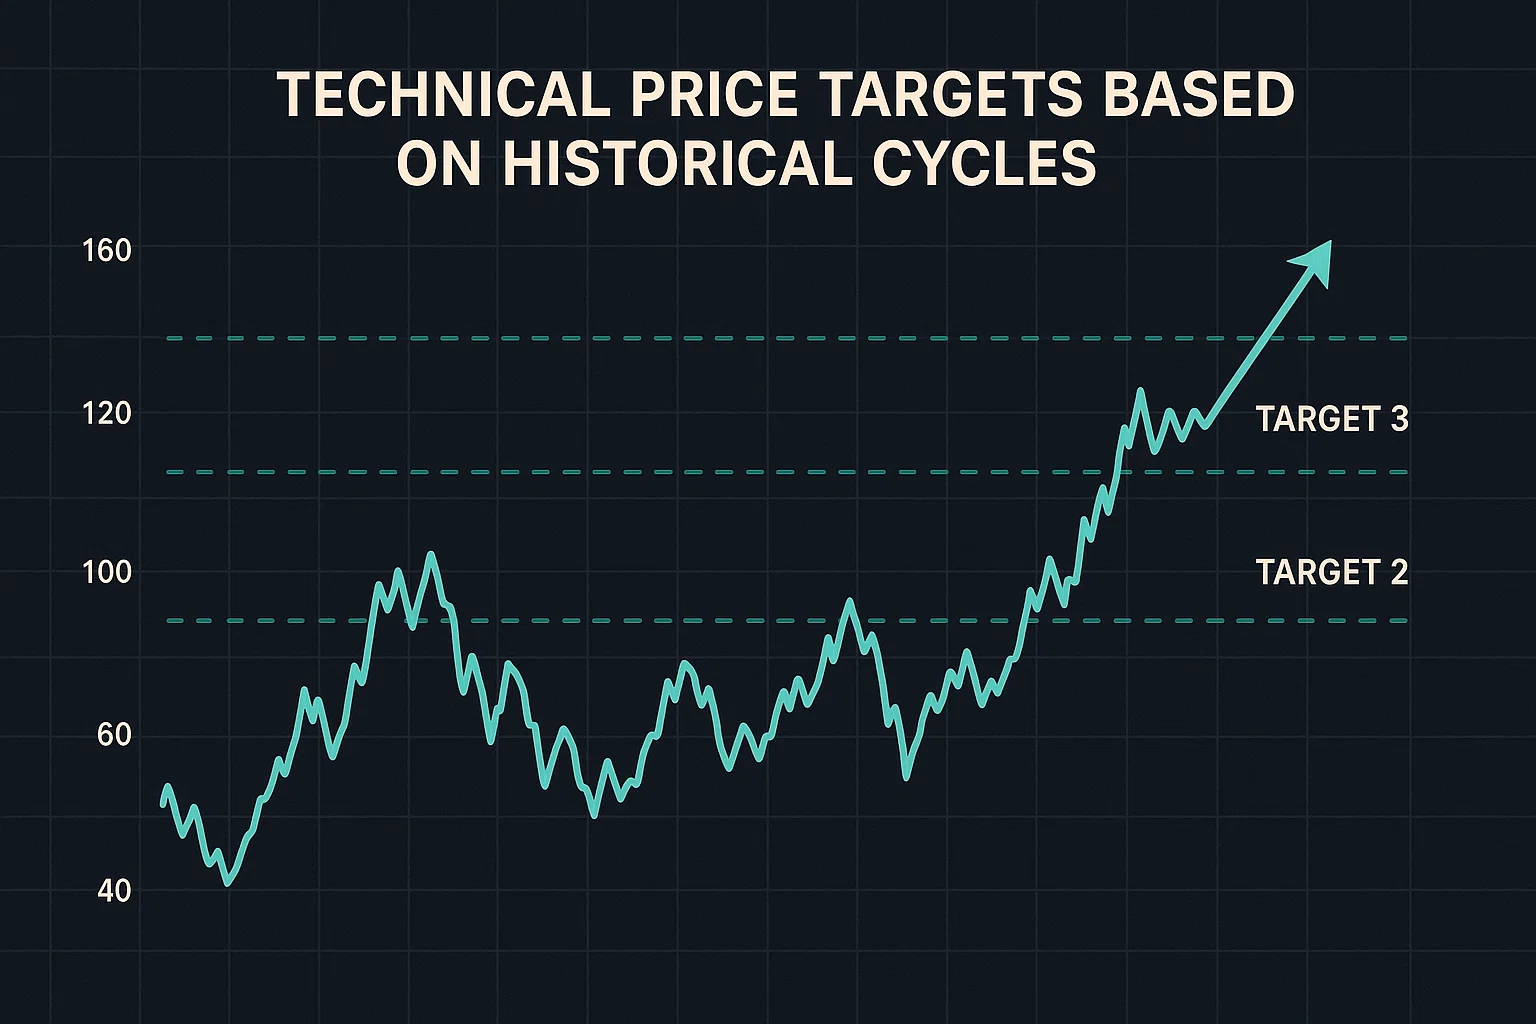
Technical analysts have identified multiple price targets based on historical cycle patterns and Fibonacci extension levels. Using previous bull market peaks as reference points and applying standard technical analysis methodologies, many analysts project that Bitcoin could reach between $120,000 and $180,000 during the next bull market peak. These targets assume similar percentage gains to previous cycles, adjusted for Bitcoin’s increasing market capitalization and maturation.
The Bitcoin MVRV bottom zone entry point provides a foundation for calculating risk-reward ratios for potential investments. Using conservative estimates that account for Bitcoin’s larger market capitalization, investors entering near current MVRV bottom levels could potentially realize gains of 150% to 300% over the next 18 to 24 months. These projections align with historical returns following previous Bitcoin MVRV bottom zone periods, though past performance does not guarantee future results.
Elliott Wave theorists have also weighed in on Bitcoin’s current position, with many identifying the recent price action as a corrective wave that is nearing completion. According to this technical framework, Bitcoin is positioned to begin a new impulse wave higher, which could drive prices to new all-time highs. The coincidence of this Elliott Wave interpretation with the Bitcoin MVRV bottom zone signal provides multiple technical perspectives supporting the bullish outlook.
Risk Factors and Considerations
While the Bitcoin MVRV bottom zone signal has historically been reliable, investors should carefully consider potential risk factors that could impact Bitcoin’s price trajectory. Regulatory developments remain a key uncertainty, with governments worldwide still formulating comprehensive frameworks for cryptocurrency oversight. Adverse regulatory actions in major markets could temporarily suppress prices, though the long-term trajectory would likely remain intact given Bitcoin’s decentralized nature.
Macroeconomic conditions, while currently supportive, could shift in ways that affect risk asset prices broadly, including Bitcoin. Significant changes in central bank policies, unexpected economic downturns, or financial system shocks could create short-term volatility that tests the resolve of even long-term holders. However, historical analysis suggests that even during adverse macroeconomic periods, the Bitcoin MVRV bottom zone has remained a reliable indicator of long-term value.
Technical execution risks in the Bitcoin network, while extremely low given its decade-plus track record, cannot be entirely dismissed. Additionally, competition from alternative cryptocurrency protocols could theoretically impact Bitcoin’s market dominance, though Bitcoin’s first-mover advantage, network effects, and security guarantees have proven remarkably durable. Investors considering accumulation during the Bitcoin MVRV bottom zone should maintain appropriate position sizing relative to their overall portfolio and risk tolerance.
Market Psychology and Timing Considerations
Understanding market psychology is crucial when investing during the Bitcoin MVRV bottom zone period. By definition, entering positions when Bitcoin is undervalued according to on-chain metrics means investing when sentiment is often negative and fear dominates market discourse. This contrarian approach requires emotional discipline and conviction in the underlying fundamentals, as prices may remain depressed or experience additional volatility before the anticipated rally materializes.
The timing of Bitcoin’s exit from the MVRV bottom zone and subsequent rally can vary significantly across cycles. While historical patterns provide guidance, the exact duration of accumulation phases ranges from several months to over a year. Investors should avoid attempting to time the precise bottom and instead focus on dollar-cost averaging strategies that allow them to accumulate positions gradually throughout the Bitcoin MVRV bottom zone period.
Patience remains paramount when investing based on long-term on-chain indicators like the MVRV ratio. Previous cycles have demonstrated that the most significant gains accrue to holders who maintain their positions through volatility and resist the temptation to trade short-term price movements. The Bitcoin MVRV bottom zone signal should be viewed as a strategic allocation opportunity rather than a tactical trading signal, with holding periods of 12 to 24 months typically required to realize the full potential of accumulation during these periods.
Comparing Bitcoin MVRV Bottom Zone to Traditional Valuation Metrics
The Bitcoin MVRV bottom zone offers advantages over traditional valuation metrics when applied to cryptocurrency markets. Unlike price-to-earnings ratios or book value calculations used for equities, the MVRV ratio leverages blockchain data to provide insights specific to Bitcoin’s unique characteristics as a digital asset. This metric accounts for the actual cost basis of holders across the network, providing a more nuanced view of value than simple price charts or momentum indicators.
Traditional financial markets lack an equivalent to the transparency provided by Bitcoin’s blockchain, making on-chain metrics like the MVRV ratio particularly valuable for cryptocurrency investors. The ability to observe the aggregate profit and loss position of all Bitcoin holders in real-time represents a significant informational advantage compared to traditional markets, where such data is either unavailable or significantly delayed. The Bitcoin MVRV bottom zone signal essentially provides visibility into a “panic selling” phase that would be invisible in traditional markets.
When compared to other cryptocurrency valuation frameworks, the MVRV ratio has demonstrated superior reliability for identifying market extremes. Metrics based solely on technical analysis or sentiment indicators often generate false signals, while the Bitcoin MVRV bottom zone has maintained a consistent track record across multiple market cycles. This reliability stems from the metric’s foundation in actual blockchain data rather than derivatives or proxies for market conditions.
Integration with Multi-Factor Analysis
Sophisticated investors typically integrate the Bitcoin MVRV bottom zone signal with multiple other analytical frameworks to develop comprehensive investment theses. Combining on-chain metrics with macroeconomic analysis, technical patterns, and fundamental developments provides a more robust foundation for decision-making than relying on any single indicator. The current environment, where the Bitcoin MVRV bottom zone coincides with favorable institutional adoption trends and supply dynamics, represents an example of such multi-factor confluence.
Risk management strategies should incorporate the MVRV ratio as one component of a broader portfolio allocation framework. While the Bitcoin MVRV bottom zone historically indicates attractive entry points, prudent investors maintain diversified portfolios and avoid over-concentration in any single asset. Position sizing should reflect individual risk tolerance, investment timeline, and overall financial objectives, with the MVRV signal informing but not solely determining allocation decisions.
The educational value of understanding the Bitcoin MVRV bottom zone extends beyond immediate investment decisions. Familiarity with on-chain metrics and blockchain analytics represents an important skill set for navigating cryptocurrency markets effectively. As the industry matures and institutional participation increases, the investors who understand these native valuation frameworks will possess significant advantages over those relying solely on traditional financial analysis tools.
Conclusion
The convergence of multiple factors suggests that Bitcoin’s entry into the MVRV bottom zone represents a compelling opportunity for long-term investors. Historical precedents demonstrate that substantial rallies consistently follow these periods of undervaluation, with gains often exceeding 150% over subsequent 12 to 24-month periods. The current cycle benefits from unprecedented institutional adoption, favorable supply dynamics following the 2024 halving, and improving macroeconomic conditions that support Bitcoin’s value proposition as a neutral, scarce digital asset.
Investors who recognize the significance of the Bitcoin MVRV bottom zone signal and act strategically during these accumulation phases have historically realized substantial returns. While short-term volatility remains a certainty and various risk factors warrant consideration, the weight of evidence suggests that Bitcoin is well-positioned for another significant bull market. The combination of on-chain indicators, technical analysis, fundamental developments, and historical patterns creates a multi-faceted case for optimism about Bitcoin’s medium-term price trajectory.
Read More: Bitcoin Price Nears $113,700 as Fed Rate-Cut Odds Surge to 98%