
The Bitcoin flash crash has sent ripples through the digital asset community. As Bitcoin’s price volatility continues to dominate headlines, investors and traders are asking a critical question: Could Bitcoin fall to $72,000? The echoes of past flash crashes serve as stark reminders that the world’s largest cryptocurrency remains susceptible to sudden, sharp price movements that can wipe out billions in market value within minutes.
Understanding the mechanics behind a Bitcoin flash crash and analyzing the current market conditions is crucial for anyone holding digital assets. With Bitcoin trading at elevated levels and macroeconomic uncertainties looming, the possibility of a significant correction cannot be dismissed. This comprehensive analysis examines the historical patterns, technical indicators, and market dynamics that could potentially trigger another flash crash event.
What Is a Bitcoin Flash Crash?
A Bitcoin flash crash refers to an extremely rapid and severe price decline that occurs within a very short timeframe, often lasting just minutes or hours. Unlike gradual bear markets, flash crashes are characterized by their sudden onset and dramatic intensity. These events typically involve cascading liquidations, where leveraged positions are forcibly closed, creating a domino effect that accelerates the price decline.
Historical Bitcoin Flash Crash Events
The cryptocurrency market has experienced several notable flash crash incidents that provide valuable context for current concerns:
The 2017 GDAX Flash Crash saw Bitcoin’s price plummet from approximately $8,500 to $0.10 on the GDAX exchange (now Coinbase Pro) within seconds due to a massive market sell order. While this was exchange-specific and quickly recovered, it highlighted the vulnerability of cryptocurrency markets to sudden liquidity shocks.
The March 2020 COVID-19 Crash witnessed Bitcoin dropping from around $7,900 to below $3,800 in just two days, representing a decline of over 50%. This crash was triggered by global pandemic fears and demonstrated how external macroeconomic events could catalyze rapid sell-offs.
The May 2021 Flash Crash saw Bitcoin plunge from approximately $58,000 to $30,000 within weeks, with particularly sharp intraday movements. This crash was fueled by China’s cryptocurrency mining crackdown and Tesla’s suspension of Bitcoin payments.
These historical precedents establish that Bitcoin flash crashes are not theoretical concerns but recurring market realities that demand serious consideration from investors.
Current Market Conditions Suggesting Potential Decline
Several factors in today’s cryptocurrency landscape are raising red flags about the possibility of another Bitcoin flash crash that could push prices toward the $72,000 level or lower.
Overleveraged Market Positions
The derivatives market has seen unprecedented growth, with open interest in Bitcoin futures and options reaching record levels. When too many traders hold leveraged long positions, the market becomes vulnerable to cascading liquidations. If Bitcoin’s price starts declining, these leveraged positions get automatically closed, creating selling pressure that can trigger a flash crash scenario.
Current data shows that leverage ratios across major exchanges have climbed to levels last seen before previous significant corrections. This concentration of leveraged positions creates a powder keg that only needs a spark to ignite.
Macroeconomic Headwinds
The broader economic environment presents several challenges that could precipitate a Bitcoin crash:
Federal Reserve Policy: Central bank decisions regarding interest rates directly impact risk assets. If the Fed maintains higher rates for longer or signals additional tightening, capital flows away from speculative investments like Bitcoin.
Recession Concerns: Economic slowdown fears typically trigger risk-off sentiment, where investors flee to traditional safe-haven assets rather than digital currencies.
Inflation Dynamics: While Bitcoin is often touted as an inflation hedge, the relationship is more complex. In certain market conditions, disinflationary pressures can negatively impact Bitcoin’s price.
Dollar Strength: A strengthening US dollar typically correlates with Bitcoin weakness, as much of Bitcoin trading is denominated in dollars.
Technical Analysis: The $72,000 Support Level
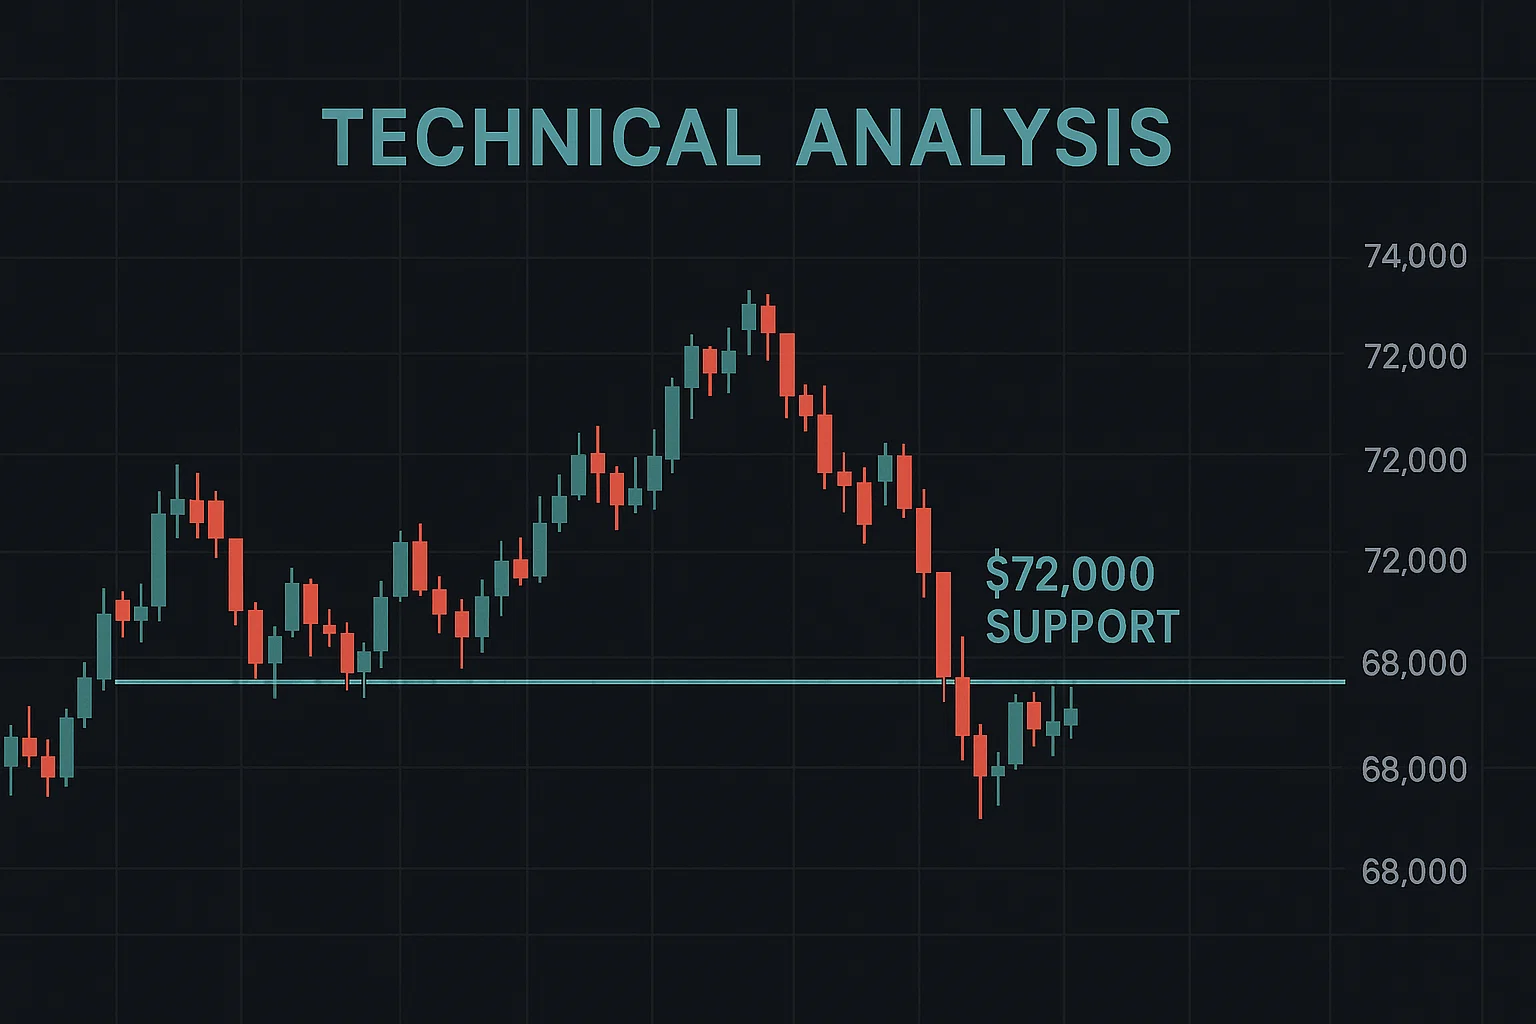
From a technical analysis perspective, the $72,000 level represents a significant psychological and structural support zone for Bitcoin. Understanding why this specific price point matters requires examining the technical architecture of Bitcoin’s recent price action.
Key Technical Indicators
Moving Average Convergence: The 200-day moving average currently sits around the $72,000-$75,000 range, making this area a crucial support zone. Historical patterns show that when Bitcoin falls below its 200-day moving average, extended bear markets often follow.
Fibonacci Retracement Levels: Based on Bitcoin’s rally from previous cycle lows to recent highs, the 50% Fibonacci retracement level aligns closely with the $72,000 region. Traders commonly use these levels to identify potential reversal zones.
Volume Profile Analysis: The $72,000 area represents a high-volume node from previous trading sessions, indicating substantial historical trading activity. This concentration of volume often acts as support during corrections.
Chart Patterns and Warning Signs
Several bearish chart patterns are emerging that could foreshadow a Bitcoin flash crash:
Head and Shoulders Formation: This classic reversal pattern, if confirmed, typically signals a trend change from bullish to bearish. The pattern’s measured move target could align with the $72,000 level.
Descending Triangle: A bearish continuation pattern characterized by lower highs and horizontal support could result in a breakdown that accelerates selling pressure.
Bearish Divergence: When Bitcoin’s price makes higher highs while momentum indicators like RSI make lower highs, it suggests weakening buying pressure and potential reversal.
The Role of Whale Activity in Flash Crashes
Large Bitcoin holders, commonly referred to as “whales,” play a disproportionate role in flash crash events. Their trading decisions can move markets significantly due to the relatively thin liquidity in cryptocurrency exchanges compared to traditional financial markets.
Whale Selling Patterns
Recent on-chain data reveals concerning patterns in whale behavior:
Exchange Deposits: When whales transfer large amounts of Bitcoin to exchanges, it often precedes selling. Increased exchange inflows from whale addresses have historically correlated with price declines.
Distribution Phases: Analysis of whale accumulation and distribution patterns shows that major holders have been gradually reducing their positions at elevated price levels, suggesting they anticipate lower prices ahead.
Coordinated Movements: While not necessarily collusion, whales sometimes move in similar patterns, creating concentrated selling pressure that can trigger a Bitcoin crash.
Retail Investor Sentiment
Retail investors, who make up a significant portion of the cryptocurrency market, often exhibit herd behavior that can exacerbate flash crash conditions:
FOMO and Panic Selling: Fear of missing out drives buying at tops, while panic selling accelerates during crashes. This emotional trading creates volatility that professional traders exploit.
Leverage Abuse: Retail traders increasingly use leverage without fully understanding the risks. When markets turn, these positions get liquidated en masse, contributing to rapid price declines.
Social Media Amplification: Fear and uncertainty spread rapidly through social media platforms, creating feedback loops that intensify selling pressure during a Bitcoin flash crash.
Regulatory Risks and Market Structure Vulnerabilities
The cryptocurrency market’s regulatory landscape and structural characteristics create unique vulnerabilities that could trigger sudden price collapses.
Regulatory Uncertainty
SEC Enforcement Actions: Aggressive regulatory actions by the Securities and Exchange Commission against cryptocurrency exchanges or projects can trigger market-wide sell-offs.
Banking Restrictions: If traditional banks further restrict cryptocurrency-related services, it could create liquidity crises that precipitate flash crashes.
Tax Policy Changes: Unfavorable tax treatment of cryptocurrency gains or transactions could reduce demand and trigger selling pressure.
Exchange Infrastructure Weaknesses
Despite years of development, cryptocurrency exchanges still exhibit vulnerabilities:
Liquidity Fragmentation: Bitcoin liquidity is spread across dozens of exchanges globally, and sudden imbalances can create price disparities that trigger arbitrage trading and cascading effects.
Circuit Breakers Absence: Unlike traditional stock markets, most cryptocurrency exchanges lack circuit breakers that halt trading during extreme volatility, allowing flash crashes to run their full course.
API Vulnerabilities: Automated trading systems can malfunction or be exploited, creating unusual order flow that destabilizes markets.
Could Bitcoin Really Reach $72,000?

Assessing the realistic probability of a Bitcoin crash to $72,000 requires weighing multiple scenarios and considering various timeframes.
Bull Case Against Major Decline
Several factors argue against a severe Bitcoin flash crash:
Institutional Adoption: Major corporations and financial institutions now hold Bitcoin on their balance sheets, providing a stability floor that didn’t exist in previous cycles.
Improved Market Infrastructure: Cryptocurrency exchanges and custodians have significantly enhanced their systems, reducing the likelihood of technical glitches that could cause flash crashes.
ETF Flows: Bitcoin exchange-traded funds (ETFs) have created new demand channels that could absorb selling pressure and prevent extreme declines.
Mining Economics: The cost of Bitcoin production creates a fundamental value floor. Miners with significant production costs are unlikely to sell below break-even levels unless forced by financial distress.
Bear Case Supporting the Decline
Conversely, several arguments support the possibility of Bitcoin falling to $72,000:
Historical Volatility Patterns: Bitcoin has consistently experienced 50-80% corrections during bull market cycles. A move to $72,000 would represent a significant but not unprecedented correction.
Macroeconomic Pressures: The combination of tight monetary policy, recession risks, and geopolitical instability creates an environment conducive to risk asset sell-offs.
Technical Weakness: If Bitcoin breaks below critical support levels, technical traders will accelerate selling, creating self-fulfilling prophecy dynamics.
Liquidity Crises: In stressed market conditions, liquidity can evaporate rapidly, allowing relatively small sell orders to cause outsized price impacts typical of flash crash events.
Derivatives Market Impact on Flash Crash Potential
The cryptocurrency derivatives market has grown exponentially, and its structure significantly influences the likelihood and severity of Bitcoin flash crashes.
Perpetual Swaps and Funding Rates
Perpetual swap contracts, unique to cryptocurrency markets, can create conditions ripe for flash crashes:
Funding Rate Extremes: When funding rates become extremely positive (indicating overwhelming long bias), it signals market overextension. A sudden shift can trigger mass liquidations.
Cross-Margining Risks: Traders often use the same collateral across multiple positions. When one position fails, it can trigger liquidations across all positions, creating cascading failures.
Options Market Dynamics
The Bitcoin options market provides insights into where traders expect prices to move:
Put/Call Ratios: Elevated put option buying suggests sophisticated traders are hedging against downside risk, potentially anticipating a Bitcoin crash.
Gamma Exposure: Large gamma imbalances can force market makers to hedge dynamically, creating feedback loops that exacerbate price movements in either direction.
Max Pain Theory: Options dealers have incentives to push prices toward levels that minimize their payout obligations, sometimes creating pressure that contributes to sudden price movements.
How to Protect Your Portfolio from a Bitcoin Flash Crash
Given the realistic possibility of significant Bitcoin price declines, investors should implement protective strategies.
Risk Management Techniques
Position Sizing: Never allocate more capital to Bitcoin than you can afford to lose completely. Conservative position sizing ensures portfolio survival even during extreme flash crash events.
Stop-Loss Orders: Implementing disciplined stop-loss levels can limit downside exposure. However, be aware that during flash crashes, stop orders may execute at prices significantly worse than intended due to slippage.
Portfolio Diversification: Don’t concentrate holdings exclusively in Bitcoin. Diversify across multiple asset classes, including traditional investments that typically move inversely to cryptocurrencies.
Advanced Protection Strategies
Put Options: Purchasing put options on Bitcoin provides defined-risk downside protection. While they cost a premium, they offer insurance against Bitcoin crash scenarios.
Hedging with Inverse Positions: Opening short positions or inverse ETF positions can offset long Bitcoin exposure during anticipated downturns.
Stablecoin Allocation: Maintaining a portion of cryptocurrency holdings in stablecoins provides dry powder to buy during crashes while avoiding fiat off-ramping complexities.
Expert Opinions on Bitcoin’s Price Trajectory
Market analysts and cryptocurrency experts offer diverse perspectives on whether Bitcoin could experience another flash crash.
Bearish Analyst Predictions
Several prominent analysts have issued warnings about potential Bitcoin weakness:
Some technical analysts point to distribution patterns among long-term holders as evidence that smart money is positioning for lower prices. They argue that Bitcoin’s parabolic moves typically end with sharp corrections that retrace 60-70% of the gains.
Macro-focused analysts emphasize that Bitcoin remains a risk asset that correlates with equity markets. If stock markets enter bear territory, Bitcoin would likely follow with exaggerated movements due to its higher volatility profile.
Bullish Counter-Arguments
Optimistic analysts counter with several points:
Long-term Bitcoin proponents argue that each market cycle establishes higher lows, and $72,000 represents a worst-case scenario rather than a baseline expectation. They point to improving fundamentals, including network security, adoption metrics, and institutional involvement.
On-chain analysts emphasize that realized price metrics (the average price at which all Bitcoins last moved) provide strong support levels well above $72,000, suggesting the market has established a higher valuation baseline.
Historical Precedents: Lessons from Past Crashes
Examining previous Bitcoin flash crash events provides valuable lessons for anticipating and navigating future volatility.
The Pattern of Recovery
Historically, Bitcoin has demonstrated remarkable resilience following crashes:
Recovery Timeframes: While flash crashes are sudden, recoveries often take weeks or months. Patient investors who buy during maximum fear have historically been rewarded.
Higher Lows Principle: Each major Bitcoin cycle has established higher low points than previous cycles, suggesting a long-term upward trajectory despite violent short-term volatility.
Catalyst-Driven Reversals: Recoveries typically begin when new catalysts emerge, such as favorable regulatory developments, institutional announcements, or technical breakthroughs.
Behavioral Patterns During Crashes
Capitulation Signals: Maximum fear, evidenced by sentiment indicators reaching extreme pessimism, often marks the bottom of crashes. Contrarian investors use these signals as buying opportunities.
Accumulation Phases: Smart money tends to accumulate during crashes when retail investors panic sell. Analyzing wallet accumulation patterns can provide insights into where bottoms might form.
On-Chain Metrics and Flash Crash Indicators
Blockchain-based metrics offer unique insights into potential Bitcoin crash scenarios that traditional analysis cannot provide.
Key On-Chain Signals
Exchange Reserves: When Bitcoin reserves on exchanges increase dramatically, it suggests holders are preparing to sell. This accumulation of selling pressure can trigger flash crash events.
MVRV Ratio: The Market Value to Realized Value ratio helps identify when Bitcoin is overextended. Extremely high readings have historically preceded major corrections.
Spent Output Profit Ratio (SOPR): This metric reveals whether investors are selling at profits or losses. Profit-taking spikes often precede price declines.
Network Momentum: Declining active addresses and transaction volumes can signal a weakening network effect and reduced demand that precedes price corrections.
Miner Behavior Analysis
Bitcoin miners play a crucial role in market dynamics:
Miner Reserves: When miners accumulate rather than sell their Bitcoin, it reduces selling pressure. Conversely, increased miner selling can contribute to crash conditions.
Hash Rate Trends: Declining hash rates might indicate miner capitulation due to unprofitability, potentially signaling price bottoms. Conversely, stable or increasing hash rates suggest miners expect higher future prices.
The Psychological Aspects of Flash Crash Events
Understanding the psychology driving Bitcoin flash crashes is essential for maintaining rational decision-making during market chaos.
Fear and Greed Cycles
The Fear and Greed Index, which aggregates multiple sentiment indicators, provides insights into market positioning:
Extreme Greed Warnings: When the index shows extreme greed, markets are often overextended and vulnerable to corrections. These periods frequently precede flash crash events.
Extreme Fear Opportunities: Conversely, periods of extreme fear often represent maximum opportunity, though catching exact bottoms during crashes is notoriously difficult.
Cognitive Biases in Crash Scenarios
Several psychological biases affect investor behavior during market turmoil:
Recency Bias: Recent price action disproportionately influences expectations. After sustained rallies, investors underestimate crash risks.
Confirmation Bias: Investors seek information confirming their existing positions, ignoring warning signs that might suggest a Bitcoin crash is approaching.
Loss Aversion: The pain of losses exceeds the pleasure of equivalent gains, causing investors to make irrational decisions during crashes, such as selling at the worst possible time.
Global Economic Factors Influencing Bitcoin Volatility
Bitcoin doesn’t exist in isolation; global economic conditions significantly influence its propensity for flash crash events.
Central Bank Digital Currencies (CBDCs)
The development of CBDCs by central banks worldwide creates both opportunities and threats:
Competition for Bitcoin: If CBDCs gain widespread adoption, they might reduce demand for Bitcoin as a medium of exchange, potentially pressuring prices downward.
Validation of Digital Assets: Conversely, CBDC development validates the digital currency concept, potentially driving long-term adoption of decentralized alternatives like Bitcoin.
Geopolitical Tensions
International conflicts and tensions can trigger risk-off market behavior:
Safe-Haven Demand: Some argue that Bitcoin serves as digital gold during geopolitical crises. However, evidence suggests Bitcoin often sells off with other risk assets during initial crisis periods.
Sanction Evasion Concerns: If Bitcoin becomes prominently used for sanctions evasion, it could trigger coordinated regulatory crackdowns that precipitate a Bitcoin crash.
Alternative Scenarios: Beyond the $72,000 Level
While $72,000 represents a significant technical level, Bitcoin could experience different trajectory scenarios.
Worst-Case Scenarios
Deeper Correction Potential: If a flash crash begins, momentum could carry Bitcoin well below $72,000. Historical crashes have seen 70-80% peak-to-trough declines, which would imply much lower prices from recent highs.
Black Swan Events: Unpredictable events such as quantum computing breakthroughs threatening Bitcoin’s cryptographic security, or coordination between major governments to ban Bitcoin, could trigger catastrophic declines.
Sideways Consolidation Alternative
Range-Bound Trading: Rather than a dramatic crash, Bitcoin might enter an extended consolidation phase, trading in a range with $72,000 as the lower bound for months.
Gradual Decline: Instead of a sudden flash crash, Bitcoin could experience a slow, grinding decline that tests the $72,000 level over weeks or months rather than hours.
Conclusion
The echoes of previous cryptocurrency market crashes serve as sobering reminders that Bitcoin flash crash events remain realistic possibilities that prudent investors must prepare for. While Bitcoin has demonstrated remarkable resilience and long-term appreciation, its journey includes violent corrections that can devastate unprepared portfolios.
Could Bitcoin fall to $72,000? The technical, fundamental, and sentiment analysis presented suggests this scenario lies within the realm of reasonable possibilities, particularly if macroeconomic conditions deteriorate or market structure vulnerabilities are exposed. The $72,000 level represents significant technical support, but support levels only hold until they don’t.